
DonorViewHelp center
Ask AIAll articlesContactContact supportSign inSign up
Browse
  • General Information & Overviews
  • Organization Account Management
  • DonorView User Management
  • Grids, Dashboards & Software Functionality
    • Grid Features
    • Views
    • Quick Queries
    • Actions Overview
    • Batch Updates
    • Dashboards
      • What is a dashboard?
      • How do I create and edit my personal dashboard?
      • Can I customize the graphics shown on the dashboards?
      • How do I print the dashboards?
      • How can I set a homepage?
      • Can I create favorite shortcuts for the workspace?
    • Advanced Analytics
    • Other Software Functions
  • CRM Module
  • Fundraising Module
  • Events Module
  • Peer To Peer Fundraising Module
  • Volunteer Module
  • General Memberships Module
  • Youth Memberships Module
  • Auctions Module
  • Email Marketing Module
  • Surveys/Forms Module
  • Reports Module
  • Constituent Portal
  • Mobile Devices & DV Connect App
  • Quickbooks Integration
  • Training
  • Blog Posts
Help center/Grids, Dashboards & Software Functionality/Dashboards

Can I customize the graphics shown on the dashboards?

Updated Jul 18, 2024·1 min read

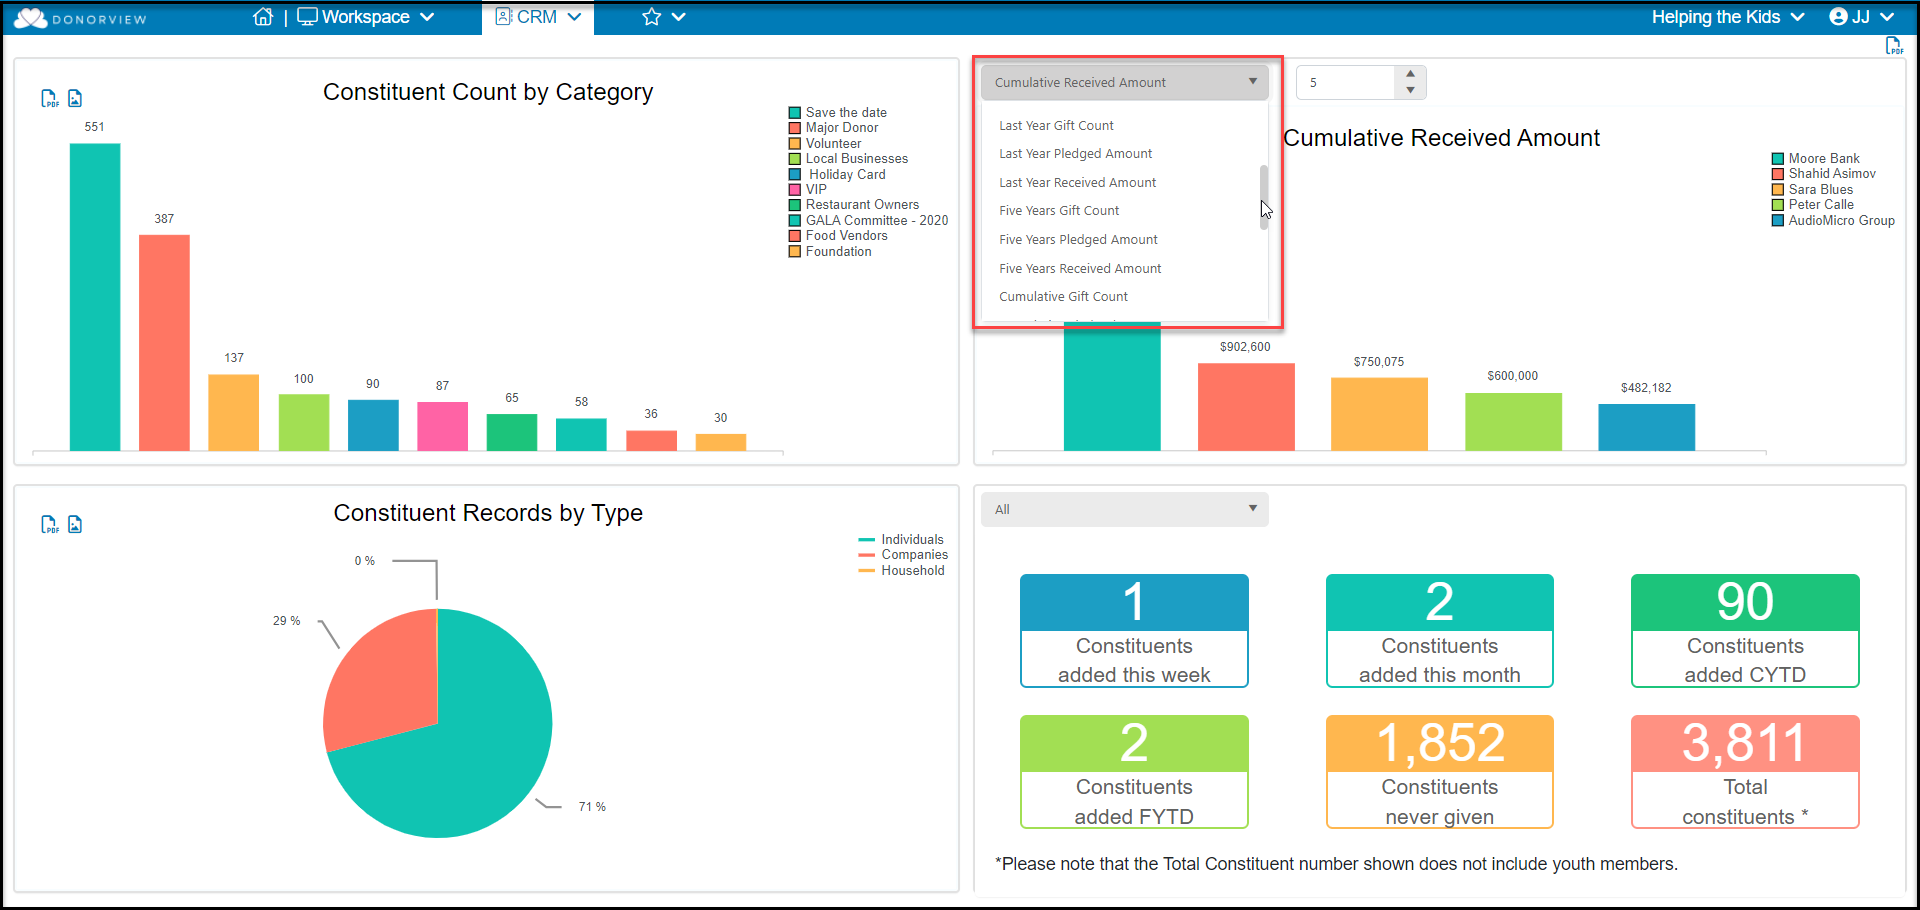
Currently, the graphics shown on the module dashboards are not editable. However some graphics have a menu option to show different data, for example the CRM Module Dashboard, you can choose different data in the graphic on the top right corner.
Was this article helpful?

Related articles

What is a dashboard?Can I create favorite shortcuts for the workspace?How can I set a homepage?How do I create and edit my personal dashboard?How do I print the dashboards?
PreviousHow do I create and edit my personal dashboard?NextHow do I print the dashboards?
© ConnectedView LLc
Help centerContact supportPowered by BlueHill