
AI Analytics - Coming Soon
Turn your donor data into smarter fundraising decisions with AI Analytics. By analyzing the information already available in DonorView, AI Analytics helps you quickly identify your strongest supporters, uncover giving opportunities, recognize donors who may be at risk of lapsing, and better understand the overall health of your donor base.
Powered by AI Agents, these insights bring together multiple data points—including giving history, transactions, interactions, communication engagement, volunteer activity, and more—to reveal trends and opportunities that may otherwise be difficult to spot. From understanding an individual donor to identifying groups ready for your next campaign, AI Analytics helps you focus your time and outreach where it can have the greatest impact.
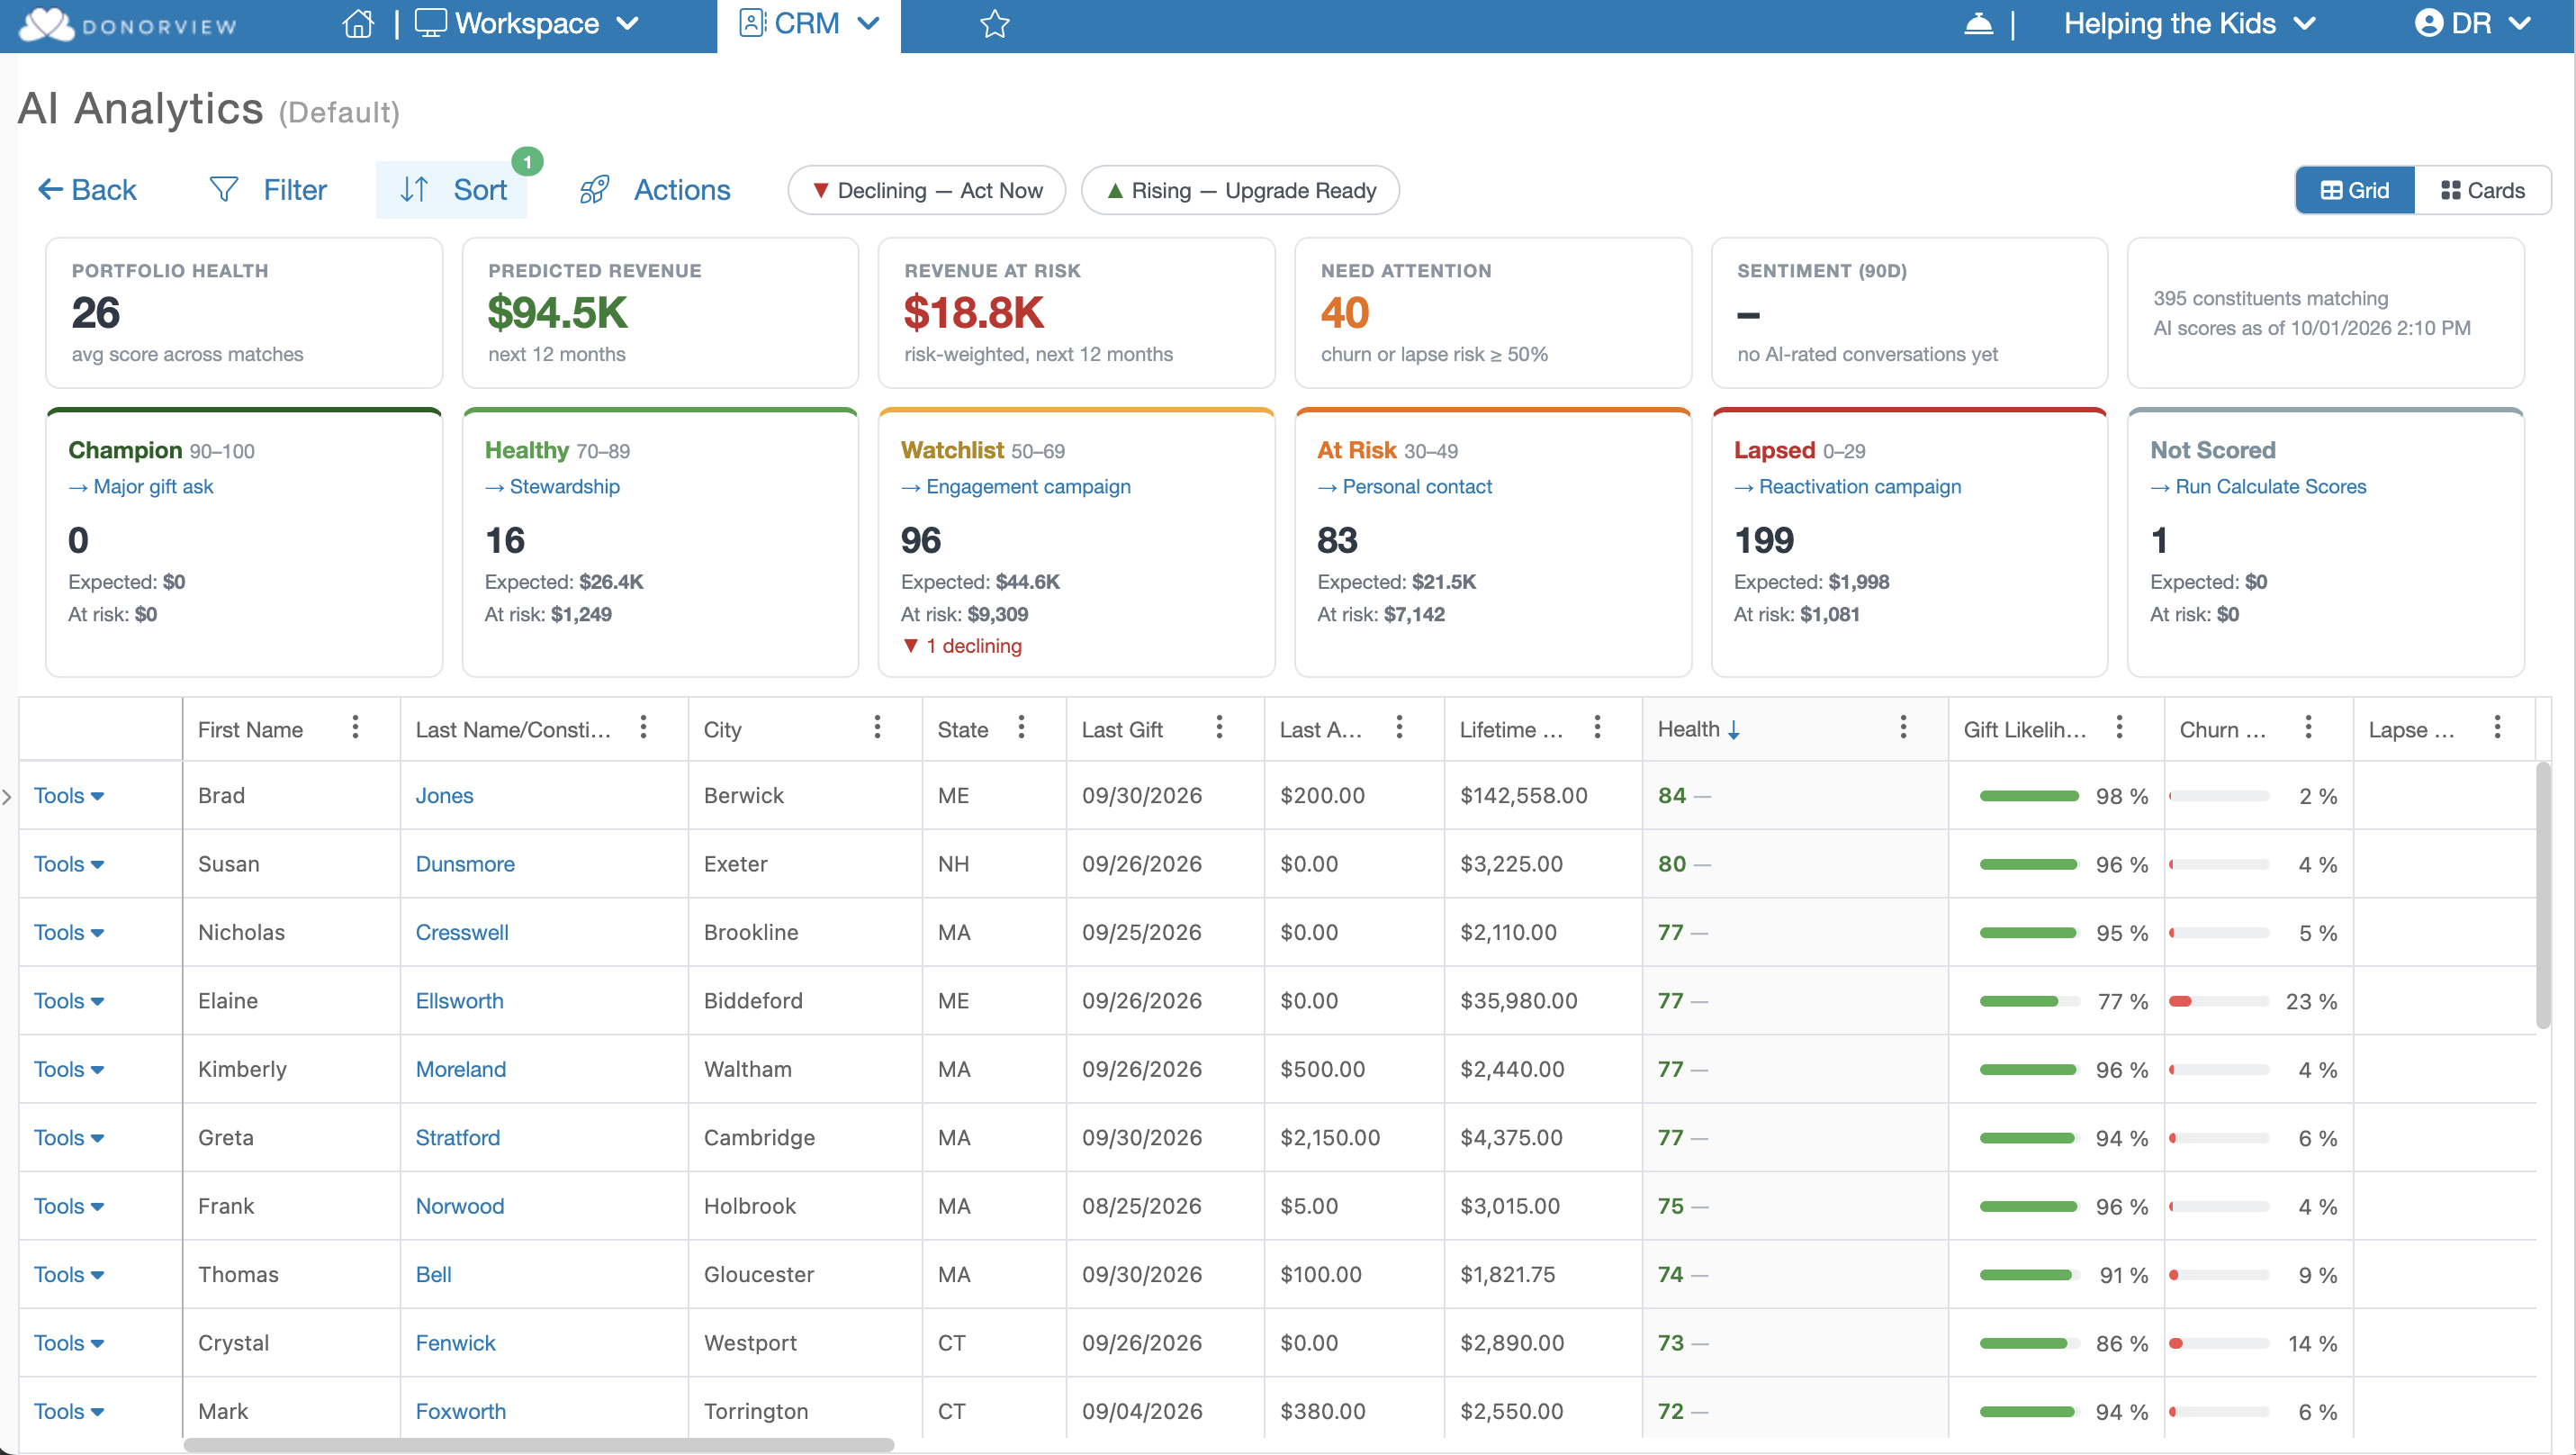
Card vs. Grid View
AI Analytics can be displayed in either Grid View or Card View.
Grid View is the default view and displays several blocks that identify different segments and categories of Constituents. Selecting a block filters the grid to show the Constituents who match that segment or category.
Card View displays each Constituent on an individual card, presenting their analytics in a more visual format. Card View is ideal for reviewing individual Constituents, while Grid View is better suited for analyzing groups or segments of Constituents and taking batch actions.
Both Card View and Grid View organize AI Analytics into the following data segments and categories.
Health Score
The Health Score is calculated using multiple factors. Each factor is scored separately and weighted to generate an overall Health Score. Factors can include giving history, cumulative giving amount, email engagement, volunteer history, and survey/form submissions.
Based on their Health Score, Constituents are divided into five categories. For each category, Expected Revenue and At Risk Revenue are displayed.
Champion (90–100) – Your top donors and strong candidates for a major gift ask.
Healthy (70–89) – Ideal candidates for stewardship and inclusion in an upcoming appeal.
Watchlist (50–69) – Consider engaging these Constituents with a campaign to increase their likelihood of giving.
At Risk (30–49) – Consider personal outreach to re-engage these Constituents.
Lapsed (0–29) – Consider a re-engagement campaign designed to reactivate these Constituents.
Not Scored – Constituents who have not yet been scored. Run Scoring to generate their Health Scores.
To filter the grid by any of these categories, simply click the desired category block. The grid will automatically filter to display all Constituents who belong to the selected category.
Along with the categories above, the AI Analytics also show the following statistics based whole of your account.
Portfolio Health – The average score across all scored factors for all scored Constituents.
Predicted Revenue – The amount of revenue predicted over the next 12 months based on giving history.
Revenue at Risk – The amount of predicted revenue over the next 12 months that may be lost if Constituents with low Health Scores are not successfully re-engaged.
Need Attention – The number of Constituents with a Churn Risk or Lapse Risk greater than 50%.
Sentiment – The overall impression based on Constituent interactions, categorized as Negative, Positive, or Neutral.
Individual AI Analytics
Individual AI Analytics for each Constituent can be found on both the AI Analytics grid and the Constituent grid. These statistics include:
Health Score – A weighted score calculated using multiple factors.
Health Trend – Indicates how the Constituent’s Health Score is trending compared with their previous score.
Gift Likelihood – Based on giving history, indicates how likely the Constituent is to give again.
Churn Risk – Based on giving history, indicates how likely the Constituent is to stop giving.
Lapse Risk – Based on historical giving frequency, indicates how likely the Constituent is to discontinue giving.
Expected (Monthly, 12-Month) – Based on giving history, estimates how much the Constituent is likely to give over different time periods.
AI Prediction Amount – Based on giving history, estimates the predicted amount of an individual donation.
AI Recommended Amount – Based on giving history, estimates an appropriate giving amount for the Constituent.
Gift Likelihood – Based on past giving and giving frequency how likely are they to give again.
Health Band – Describes the Constituent’s relationship with your organization based on giving history and other data points.
Lifetime Score – Compares the Constituent’s cumulative donation amount with that of other donors.
Frequency Score – Based on how frequently the Constituent has given.
Recency Score – Based on how recently the Constituent made their last gift.
Survey Score – Based on the number of surveys/forms the Constituent has submitted.
Trend Score – Compares the Constituent’s giving this year with their giving last year.
Volunteer Score – Based on how frequently the Constituent volunteers and their cumulative tracked volunteer hours.
Why – Identifies the key factors contributing to the Constituent’s Health Score.
AI Analytics are updated every 5 days. However if you need to manually update a Constituent's AI Analytics in real time you can do so by finding their record on the AI Analytics grid, clicking on their Tools menu and selected the Recalculate Score option.